
Veja também


 25.09.2026 06:36 AM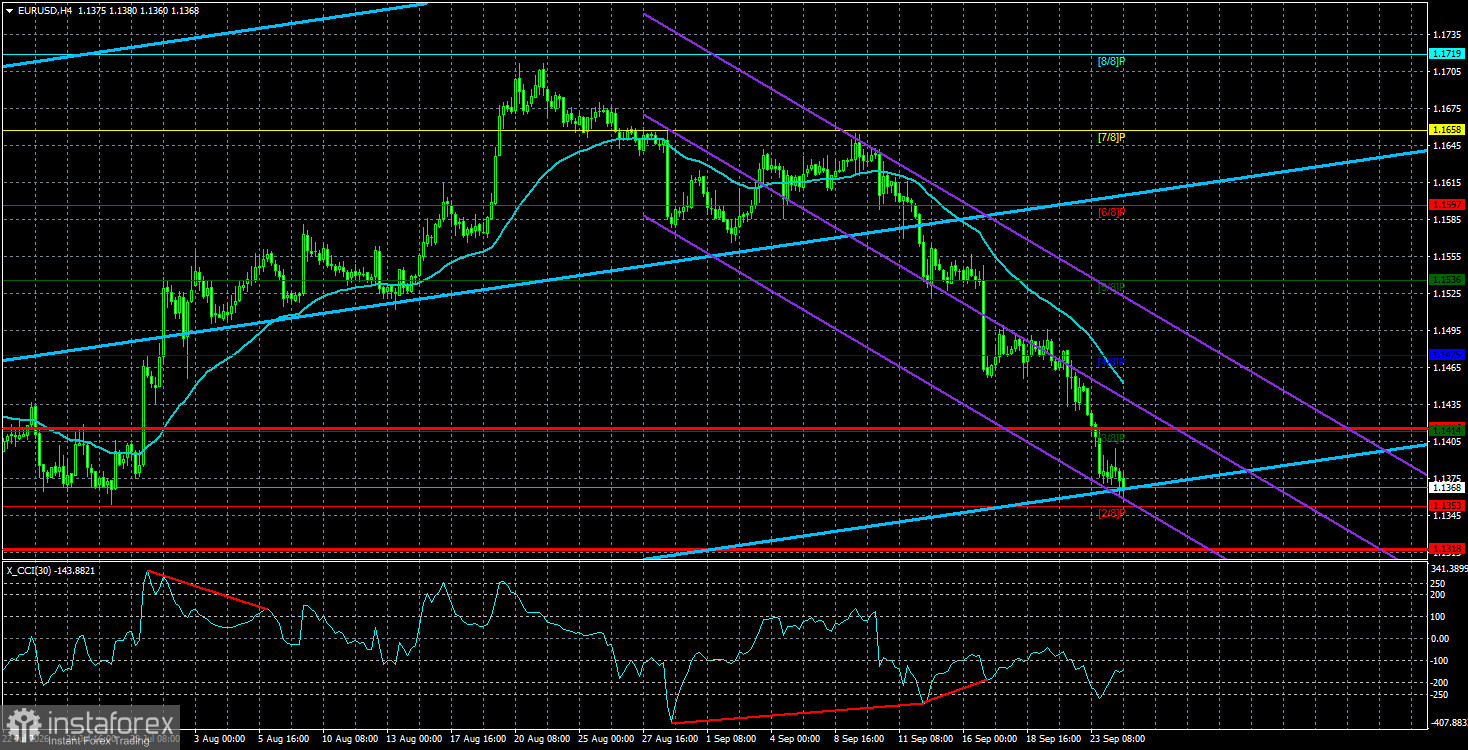
To understand this question, we need to recall a few facts. Last year the Federal Reserve was forced to cut the key rate three times because the labor market slowed, risking higher unemployment and a failure to meet one of the Fed's two mandates — full employment. We calculated average monthly job creation for 2025: 19,000. On that basis, the Fed cut the key rate by 0.75%.
Now examine 2026. This year, the economy has been creating an average of 80,000 jobs per month. That is nearly three times last year's pace, but does it mean the US labor market is fully healed? Recall that a "normal" Nonfarm Payrolls reading is 150–200,000 per month. Eighty thousand is certainly better than twenty, but still far from ideal. So the US labor market has improved somewhat but remains well short of optimal conditions.
Next fact. All summer, while the market was actively expecting tighter monetary policy, none of the FOMC members spoke about high inflation or the urgent need to fight it. Some even noted mid-term disinflation, and at the July meeting only three officials voted for a rate hike. US inflation fell from 4.2% to 3.4% between May and August. So inflation has been easing recently — yet at this same time Fed officials began, almost in unison, to warn about high inflation and to downplay labor-market risks. Put simply, FOMC members are now saying the labor market can be neglected and that there is little risk of it cooling. But — and this is crucial — if the key rate rises, labor-market risks will appear. It cannot be otherwise. Therefore the Fed seems set to fight high inflation first, sacrificing the labor market, and only later — perhaps — to support the labor market at the cost of higher inflation.
We think the Fed cannot simply ignore Nonfarm Payrolls, which for a long time served as an almost sole driver of the Committee's stance. If next month Nonfarm Payrolls again trend toward zero, we will likely see a rapid 180° reversal in the Fed debate. Nonfarm Payrolls would return to the top of the agenda, and inflation would be re-prioritized.
We also believe there may be manipulation of the dollar's exchange rate at a very high level. Nobody today can convincingly explain the dollar's rise without resorting to cliches like "increased risk aversion." It feels as if, should the dollar continue to strengthen for another month, experts will again attribute it to a hawkish Fed stance. Therefore, we advise traders to be extremely cautious with the current move. It can be traded on technical factors, but do not assume the dollar will rise forever. A reversal could be swift and unexpected.
The EUR/USD pair continues to move downward, but we still view the decline as a correction before a new upward trend. The global fundamental backdrop for the dollar remains negative, but in 2026, geopolitics first, and then the Fed's hawkish stance, provided strong support to the US currency. When price is below the moving average, consider short positions with targets of 1.1353 and 1.1318. Above the moving average, long positions are relevant with targets of 1.1475 and 1.1536.
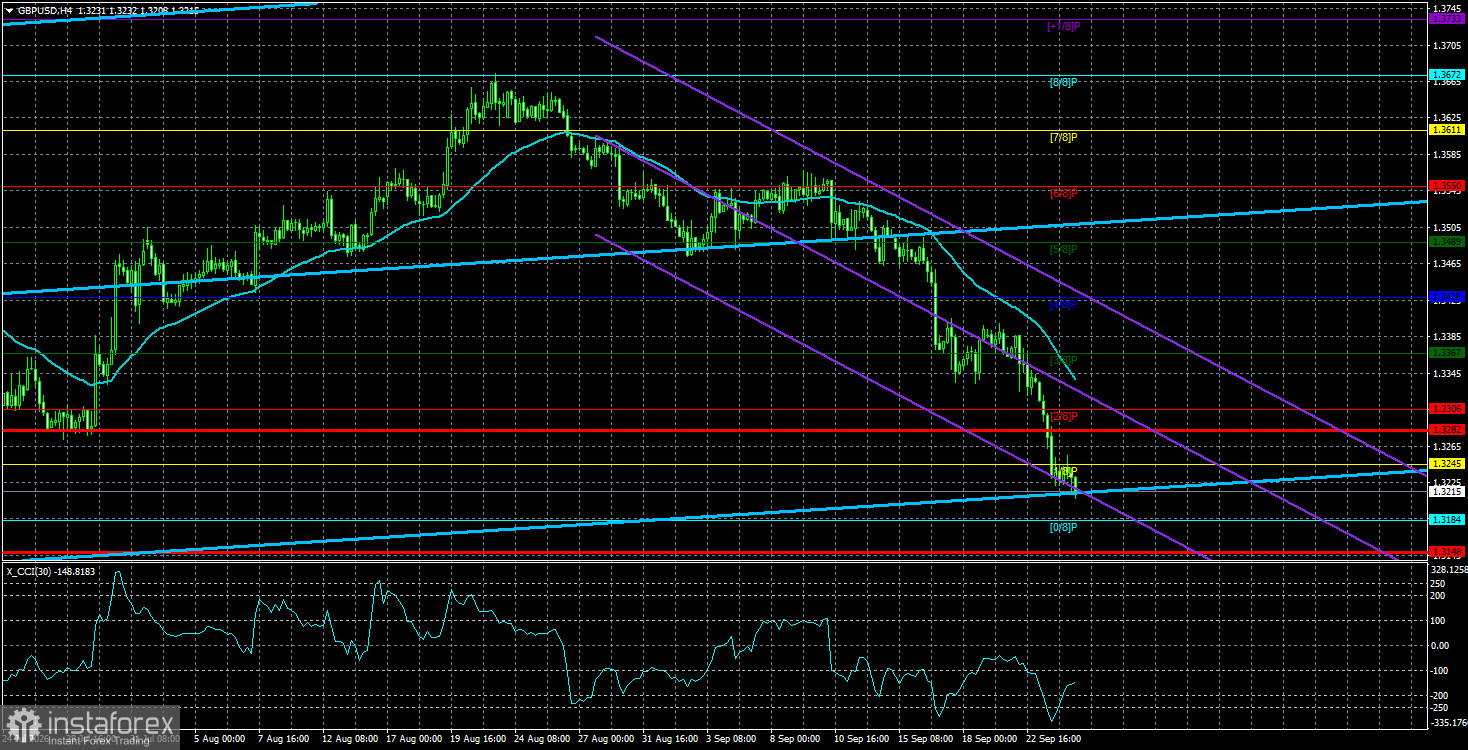
The GBP/USD pair continues its illogical downward movement. Donald Trump's policies will continue to pressure the US economy, so we do not expect long-term gains from the US dollar. 2026 has been positive for the dollar so far due to geopolitics and inflation, which forced capital to seek refuge and prompted the Fed to return to tightening monetary policy. However, on the weekly timeframe, a flat range between 1.3150 and 1.3780 persists within a four-year uptrend, which allows for expecting pound strengthening in the medium term. Consider long positions with targets of 1.3428 and 1.3489 when price is above the moving average. Price below the moving average allows bearish trading, with targets of 1.3184 and 1.3148.
Regression channels help determine the current trend. If both are directed in the same direction, it means the trend is currently strong;
The moving average line (settings 20,0, smoothed) defines the short-term trend and the direction in which trading should be conducted at present;
Murray levels are target levels for moves and corrections;
Volatility levels (red lines) are the probable price channel within which the pair will spend the next 24 hours based on current volatility indicators;
The CCI indicator – its entry into the oversold area (below -250) or the overbought area (above +250) indicates that a trend reversal in the opposite direction is approaching.


