
Veja também


 11.11.2026 12:57 PM
The four-hour (H4) chart for Bitcoin (#Bitcoin) reveals a clear negative performance and bearish momentum that is accelerating over time. Currently trading at 74,149.21, the price has experienced a sustained decline, breaking through several critical technical levels and weekly pivot points—a development that underscores the firm control of the bears (sellers) over the short-term trend and increases the likelihood of further downside.
However, it is worth noting that the price is currently rebounding from a strong support level defined by the lower boundaries of the price channels.
Technical Analysis and Price Action:
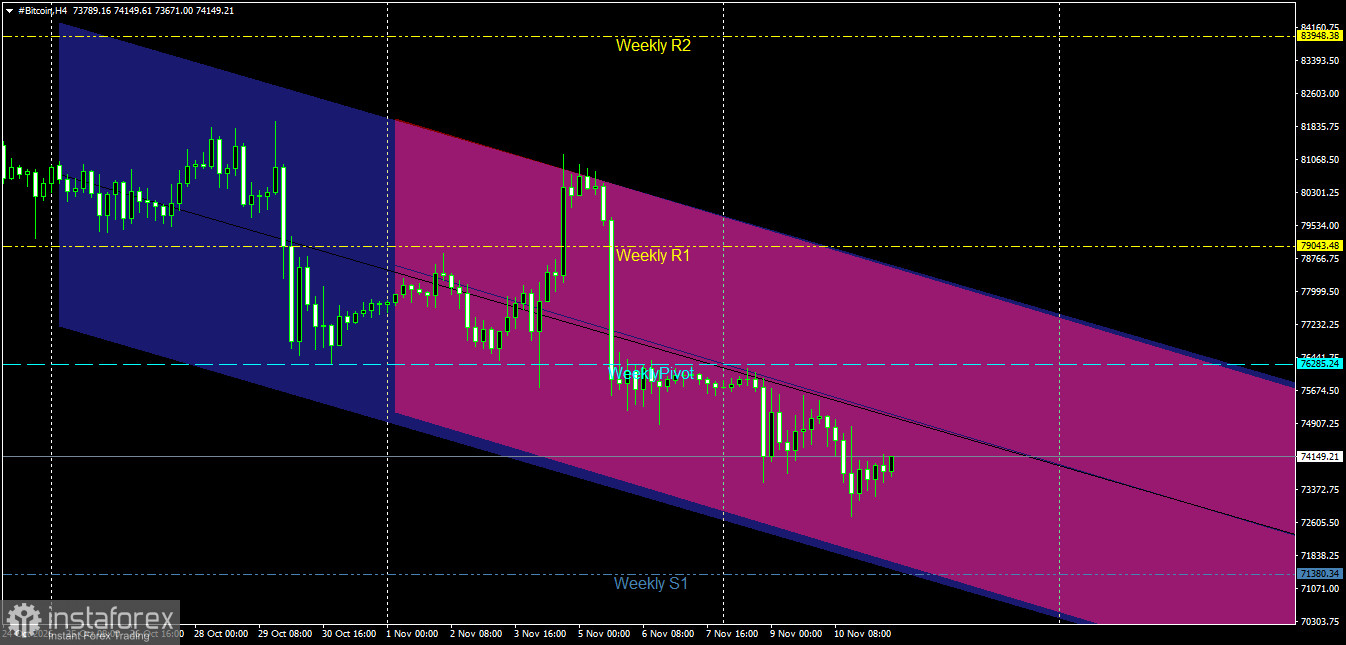
Price Channel Structure: The price is moving within a broad, primary descending channel (in blue), which reflects the overall negative trend. Overlaid on this is a steeper, secondary descending channel (in pink) that is exerting significant downward pressure, driving the price to reach successive lows. The price appears to be stabilizing near the lower and middle boundaries of these channels, amid weak attempts to establish temporary support bases following a sharp decline from previous highs.
Interaction with Pivot and Resistance Levels: The price has failed to sustain its earlier gains or remain above key pivot levels—specifically the weekly pivot at 76,285.24—as well as upper resistance levels, such as the Weekly R1 at 79,043.48. As a result of this failure, the price has dropped clearly below the pivot levels, moving steadily toward the first weekly support level (Weekly S1) at 71380.34.
Key Support and Resistance Levels:
Major Resistance Levels:
First Resistance: 76285.24 (Weekly Pivot point and the threshold for the intraday trend).
Second Resistance: 79043.48 (First Weekly Resistance, Weekly R1).
Key Resistance: 83948.38 (Second Weekly Resistance, Weekly R2).
Major Support Levels:
First Support: 73000.00 (Intraday psychological barrier and recent trading low).
Second Support: 71380.34 (First Weekly Support, Weekly S1, and the immediate target for bearish momentum).
Key Support: The 70000.00 area and below, should the price collapse continue and selling pressure intensify.
Price Action Outlook and Trading Recommendations:
Bearish Scenario (Primary):
The negative trend remains dominant and most likely as long as the price stays below the nearby resistance levels and the weekly pivot point of 76285.24.
Recommendation: It is advisable to sell into any corrective upward rebound toward the 75000.00 – 76000.00 range, provided these levels continue to cap any price gains. Technical Targets: Aiming to break through the current support level, reaching toward the first weekly support level at 71,380.34, and subsequently extending toward 70,000.00.
Corrective Bullish Scenario (Alternative):
This scenario is triggered if significant buying pressure emerges, successfully lifting prices from current lows and breaking through technical resistance levels.
Condition for Validation: A 4-hour candle must close clearly above the weekly pivot level of 76,285.24.
Technical Targets: This would pave the way for a deeper positive correction, targeting the first weekly resistance level at 79,043.48.
Risk Management:
Navigating cryptocurrency markets during periods of sharp decline requires strict adherence to capital management rules. Risk per trade should be capped at a maximum of 2%, and stop-loss orders must be precisely implemented to protect the portfolio against severe reversals and sudden shifts in momentum.
Bitcoin Price Action on the Daily Chart:
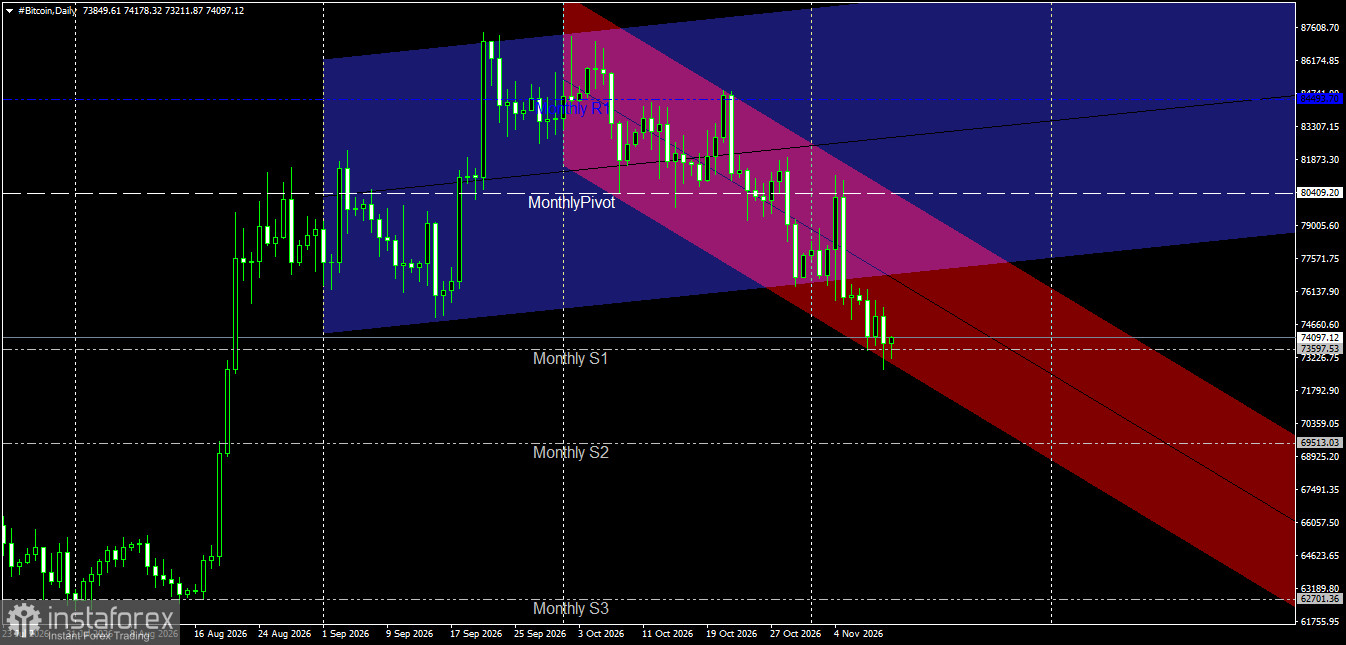
The price is currently trading at 74,097.12 within a descending channel on the daily timeframe. It has experienced a sharp decline and persistent selling pressure, leading to a breakdown below the monthly pivot point at 80,409.20 and the first monthly support level (Monthly S1) at 73,597.53.
Analysis of the Last Two Candles (Yesterday's and Today's):
Yesterday's Candle: Reflected intense selling pressure and an accelerated decline that broke through key support levels, confirming the dominance of negative momentum within the descending channel.
Today's Candle: Shows a continuation of the downward momentum, with the price attempting to reach new lows near 74,097.12 amid clear bearish dominance. However, it is worth noting that the price is currently attempting to find support near the monthly support level and the lower boundary of the channel; this could potentially trigger a corrective move back toward the broken channel line, at approximately 76,660.
Outlook for Future Movement:
Bearish Scenario (Primary): This remains the most likely outcome as long as the price stays below the broken support levels and the monthly pivot point. The decline could continue, targeting the next monthly support level at 69,513.03 (Monthly S2). The bullish scenario (alternative): This comes into play if sudden buying pressure emerges, pushing the price to rebound and return above the 73,597.53 level (Monthly S1), thereby alleviating negative pressures.


