
यह भी देखें


 12.11.2026 09:27 AM
The crypto market is losing fuel for a rally: the supply of the largest stablecoins fell by $14.2 billion over the past 30 days — the biggest drop since the 2022 bear market — and total supply slid just below $280 billion, back to September 2025 levels.

To understand what this means, recall how stablecoins work. They are issued when money flows into crypto and burned when money leaves, so they effectively represent cash inside the system used to buy Bitcoin, provide margin, and trade on exchanges. When supply grows, new dollars enter the market, buying power and liquidity rise, and any price advance has fuel. When supply contracts, holders swap stablecoins for dollars and withdraw those funds from the market, leaving less buying power for bounces.
It's important not to overread the indicator. Stablecoin supply does not predict price so much as confirm where money is going, and it often shrinks after prices fall. That is why many traders view a renewed increase in stablecoin supply as the first sign that fresh capital is arriving, rather than as the sole cause of a market turnaround. Bitcoin is down about 17% year-to-date, and spot ETF outflows totaled $1.28 billion in the week of Nov 2–6, so the decline in stablecoins adds another independent channel of withdrawals.
The current $14.2 billion reduction is roughly half the peak-rate withdrawals seen in 2022, so it is noticeable but not yet catastrophic. The pace this year has accelerated: in June stablecoins lost $7.7 billion — the largest monthly drop since May 2022 — and by Aug 2 total supply was about $307.6 billion, meaning the market is now smaller by more than $27 billion. Earlier, in early October, 30-day fresh capital (including ETFs and stablecoins) was estimated at about $4.9 billion, supporting the market then; now inflows have flipped to outflows. One caveat: a similar drop from Dec 2025 to Feb 2026 later reversed over several months, so current shrinkage is not necessarily irreversible.
I believe that until stablecoin supply stabilizes, any Bitcoin bounces will be short-lived because there will be fewer buyers. A strong dollar and expectations of a 25-bp Fed hike on Dec 9 make US Treasuries more attractive to liquidity that previously sat in stablecoins, creating competition for capital.
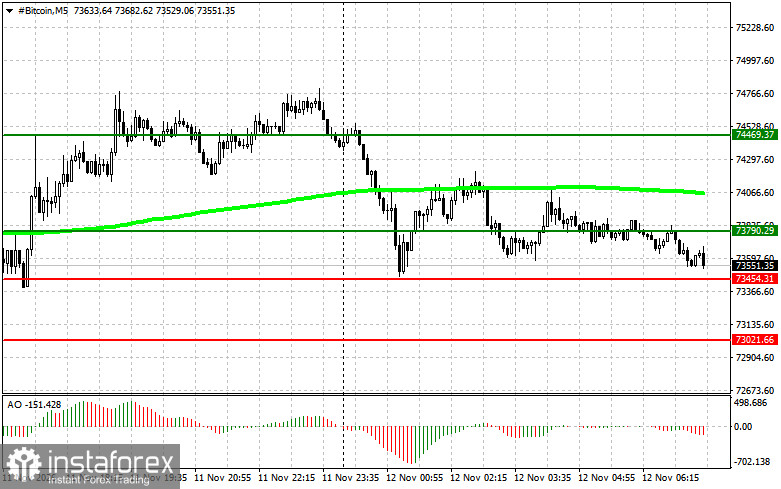
Price trades in a narrow range from 73,400 to 73,800, and the plan is built around two mirrored directions with full breakout and rejection scenarios. For buy positions, I consider a break above 73,800 with a target of 74,500 — a sensible level to take profit and then consider a short on the pullback — provided price stays above the 50-day moving average and the Awesome Oscillator is above zero. If a break below 73,400 proves false and price returns to the range, buying is possible, with an initial target of 73,800 and a secondary target of 74,500.
For selling, the signal is a confirmed close below 73,400 with a target of 73,000, provided the 50-day MA is above price, and the Awesome Oscillator is below zero. If a break above 73,800 fails to hold and price returns to the range, a short is possible, targeting 73,400 first and then 73,000.
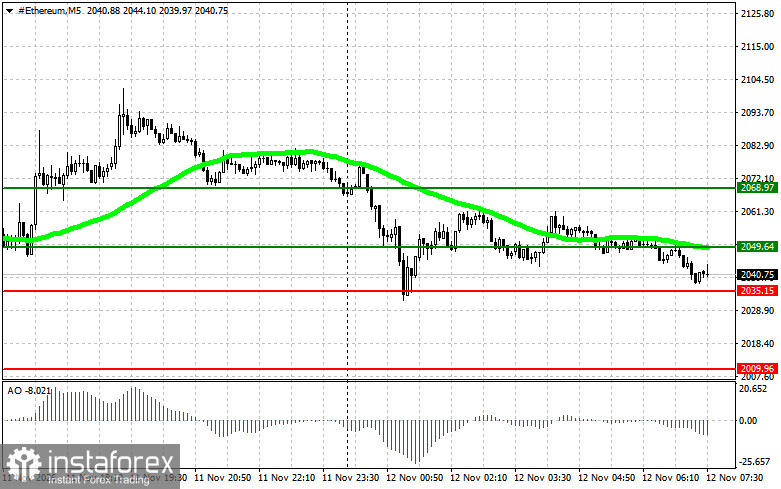
The logic fully mirrors Bitcoin on its own price scale; the working range is 2,035–2,049. Buy on a break above 2,049, targeting 2,068, where it makes sense to take profit and consider a short on the pullback—provided price is above the 50-day MA and the Awesome Oscillator is above zero. If a break below 2,035 proves false and price reclaims the range, buying is acceptable with targets at 2,049 and then 2,068.
Selling is possible after a confirmed close below 2,035, targeting 2,009, provided the 50-day MA is above price, and the Awesome Oscillator is below zero. If a break above 2,049 fails to hold and price returns to the range, consider a short position to 2,035 and then 2,009. Both indicators serve only as filters to cut false moves, not as standalone triggers to enter early, and decisions are made only after price confirms the specified levels.

