
यह भी देखें


 11.11.2026 06:07 AM
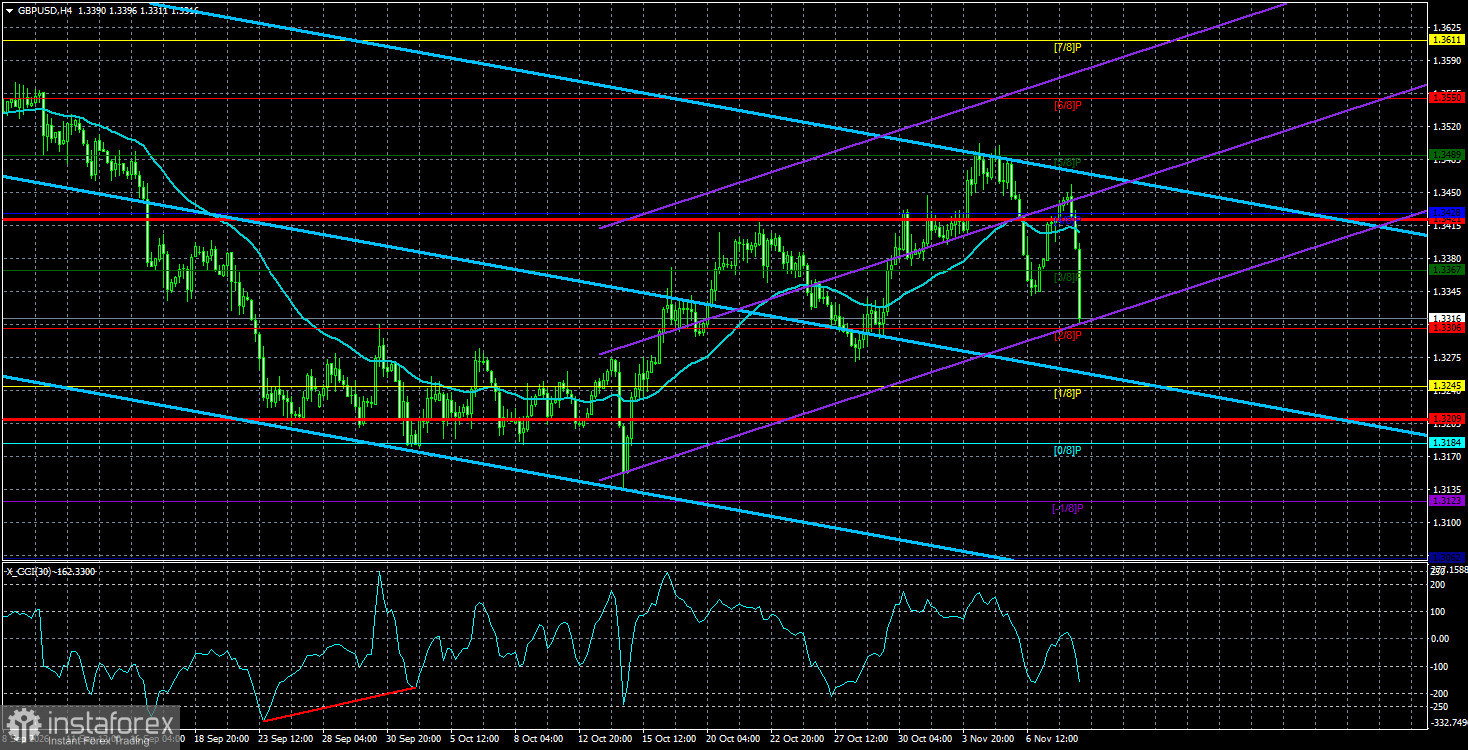
The GBP/USD pair plunged about 160 pips on Tuesday after the US inflation report... Inflation remains a key indicator for central banks, which many experts believe are currently driving exchange rates. We don't think that is entirely true, but we do acknowledge inflation's importance as a macroeconomic indicator. However, it is somewhat overvalued at present.
Consider this: the Federal Reserve's December 2026 decision is already effectively known. What does that mean? It only means the market has long since priced in the second round of tightening. Of course we cannot know what inflation will be in early 2027, whether the Middle East conflict will end, whether oil will rise to $150 per barrel, and many other unknowns. If inflation continues to rise, market hawkishness will obviously increase. But we again stress that the European Central Bank and the Bank of England are raising key rates just as the Fed is. Therefore, one should not expect the US dollar to rise solely based on Fed tightening.
You cannot expect that if you are talking about logical and consistent moves. If the market continues to buy the US currency (at least versus the euro) for speculative reasons, then fundamentals and macroeconomics can be ignored—for a while. We again emphasize that among the huge flow of news, events, and factors, traders must pick those that currently matter and influence a given currency's rate. If there are no such factors, do not invent them.
Inflation reports matter when the market does not understand how a central bank will act in the near future. When a tightening or easing cycle has not yet begun but is only expected, then the market debates fiercely how much the central bank might change the key rate. Recall that in 2022 the dollar began falling long before the Fed started cutting the key rate. In other words, the Fed continued to tighten while the dollar fell — why? Because US inflation began to decelerate and the market started expecting the tightening cycle to end. That is why US or EU inflation no longer carries the same weight: the ECB, BoE, and Fed will continue raising key rates in the coming months. Traders even know the pace central banks plan to use — approximately every second meeting. So there is no intrigue about central banks' actions now, and individual inflation reports cannot change central banks' monetary stance.
The British pound remains in an uptrend, and we believe the rise will continue based on technical factors on the daily and weekly charts.
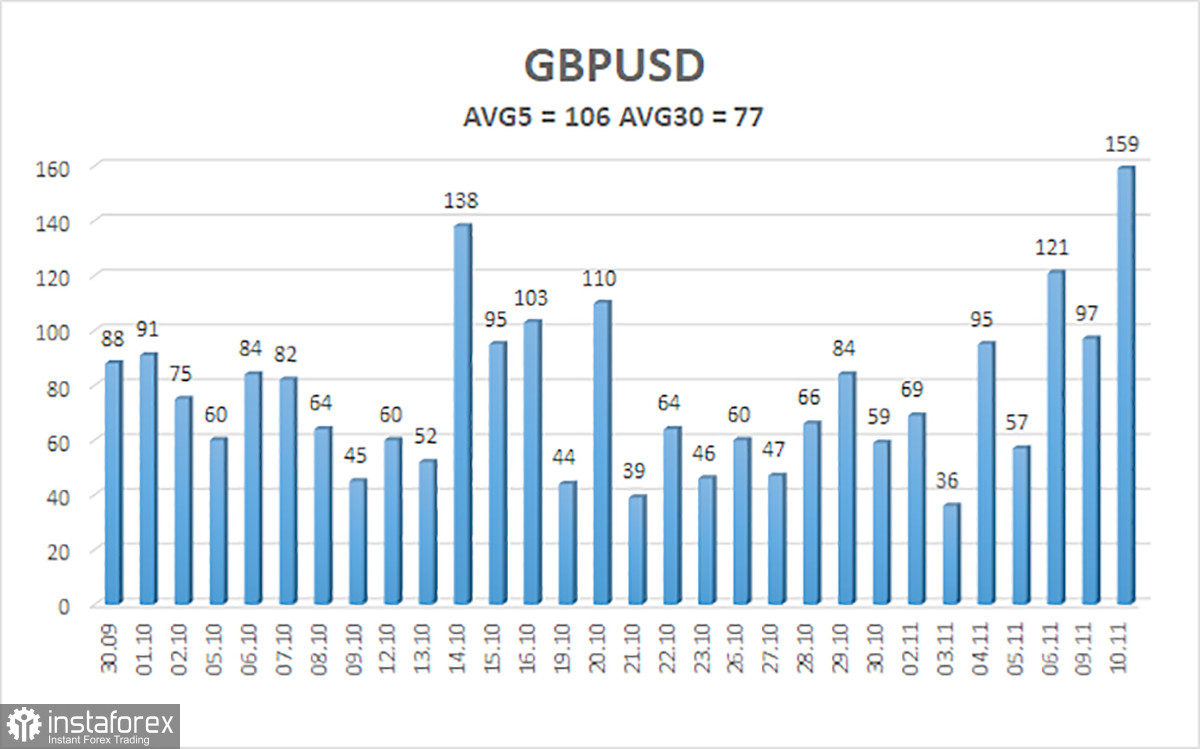
The average volatility of the GBP/USD pair over the last 5 trading days is 106 pips. For the pound/dollar pair, this value is considered "average." On Wednesday, November 11, we therefore expect movement inside a range bounded by 1.3209 and 1.3421. The major linear-regression channel has turned down again. The CCI indicator has not recently entered overbought/oversold areas or formed divergences.
S1 – 1.3306
S2 – 1.3245
S3 – 1.3184
R1 – 1.3367
R2 – 1.3428
R3 – 1.3489
The GBP/USD pair continues an uptrend that could become part of the broader 2022 global trend. Donald Trump's policies will continue to pressure the US economy, so we do not expect long-term appreciation of the US dollar. In 2026, the dollar has been positive so far due to geopolitics and inflation, which drove capital to safety and prompted the Fed to return to monetary tightening. However, on the weekly timeframe, the dollar has been flat between 1.3150 and 1.3780 within a four-year uptrend, supporting expectations of sterling appreciation in the medium term.
Long positions with targets of 1.3489 and 1.3523 can be considered when the price is above the moving average. Price below the moving average allows downside trading, with targets of 1.3245 and 1.3209.

