
यह भी देखें


 23.09.2026 07:35 AM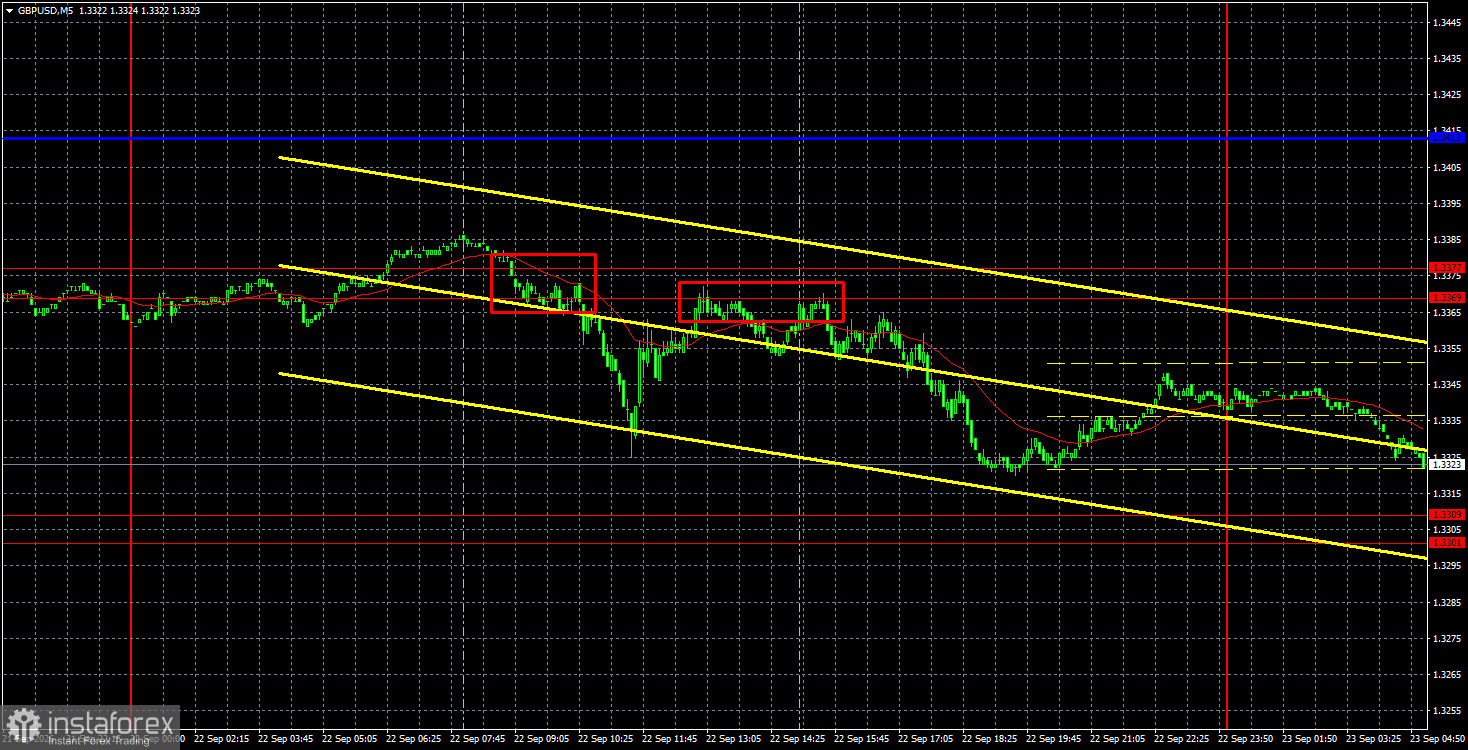
The GBP/USD pair unexpectedly resumed downward movement on Tuesday. From a technical perspective, the pound's decline on the lower timeframes looks entirely consistent. On higher timeframes, a year-long flat and the four-year uptrend remain intact, so we still expect GBP/USD to rise in the long term. However, 2026 has been a banner year for the US dollar: first the Iran war and then the Federal Reserve's hawkish shift provided powerful support to the dollar, which has been rising repeatedly this year. In the long run, that advance looks weak, but the dollar's steady mid-term gains are a small victory. Yesterday and Monday, no major events in the UK or US triggered fresh GBP/USD selling. It appears traders are simply executing the technical picture alongside Fed hawkishness while ignoring other factors — for example, the Bank of England could hike at its next meeting and again in February, but that fact currently receives little market attention.
Technically, the pound continues forming a downtrend, as shown by the trend line and price trading below the Ichimoku lines. Sterling can now, at best, expect corrective moves within the downtrend. Despite the lack of local bearish drivers, we see no market willingness to buy the pound.
On the 5-minute timeframe on Tuesday, two sell signals formed. Price first settled below and then bounced from the 1.3369–1.3377 area, allowing traders to open short positions twice. Price fell roughly 30 pips on each move, and today it may continue down toward the 1.3301–1.3309 area.
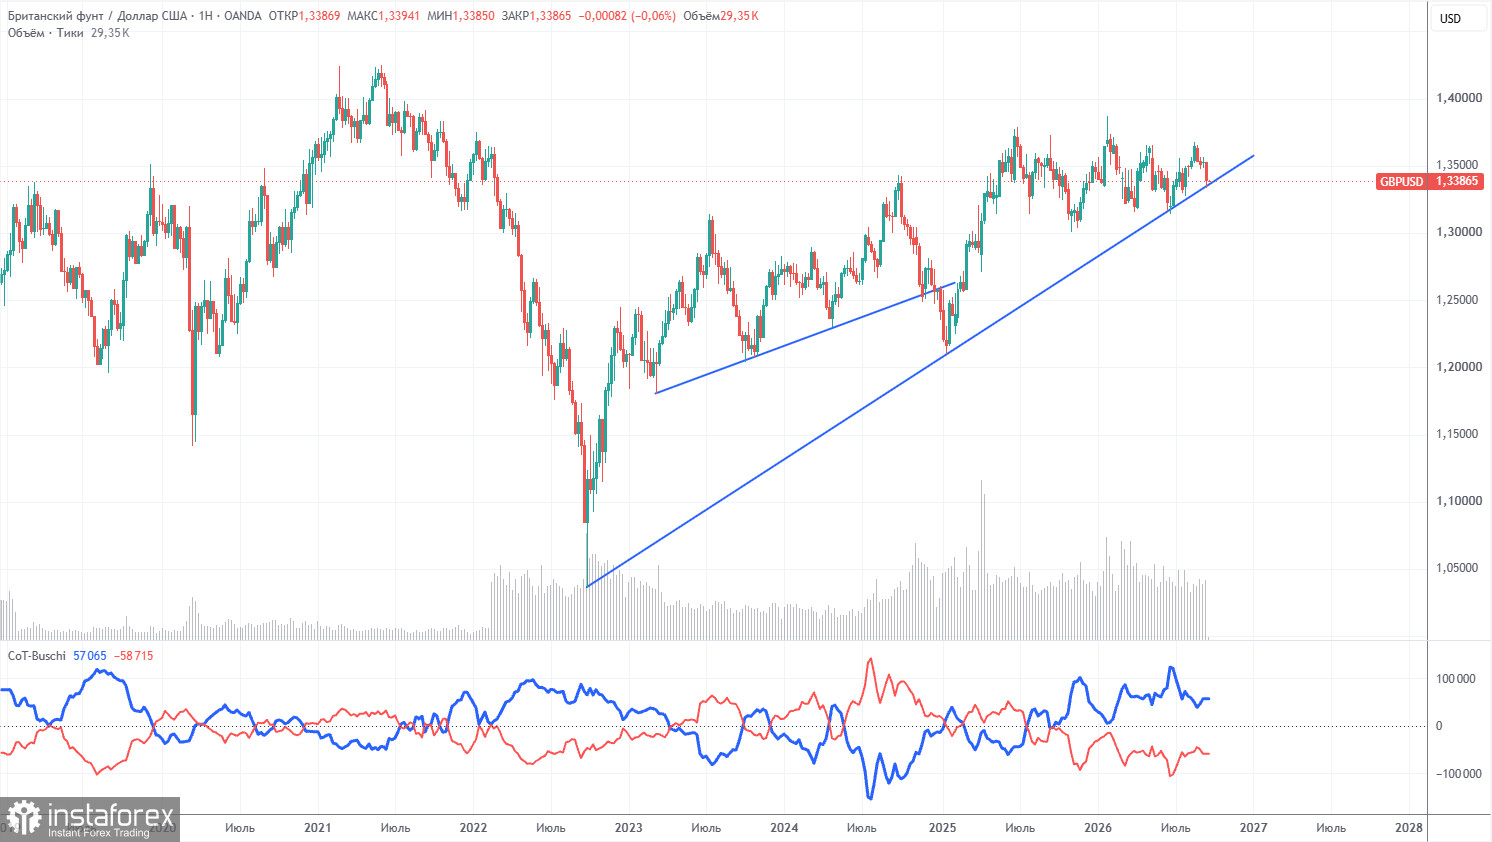
COT reports for the pound show that non-commercial traders have dominated the market with short positions for several months. The net position is negative despite the persistent long-term uptrend. Given events in the Middle East, it is unsurprising that dollar demand was high in the first half of 2026. The war is formally over, but the conflict persists. Only geopolitics can support the US dollar in the near term. However, until the pair closes below the trend line, we don't expect a strong, sustained decline.
In the long run, the dollar continues to weaken due to Trump's policies, as seen on the weekly timeframe. The trade war will continue in one form or another, and Trump's policy aims directly and indirectly to weaken the US currency. The long-term uptrend remains, as indicated by the trend line. Price recently tested that line and bounced off it. According to the latest COT report (dated September 15), the "Non-commercial" group closed 4,200 BUY contracts and 4,300 SELL contracts. Thus, the non-commercial traders' net position rose by 100 contracts over the week.
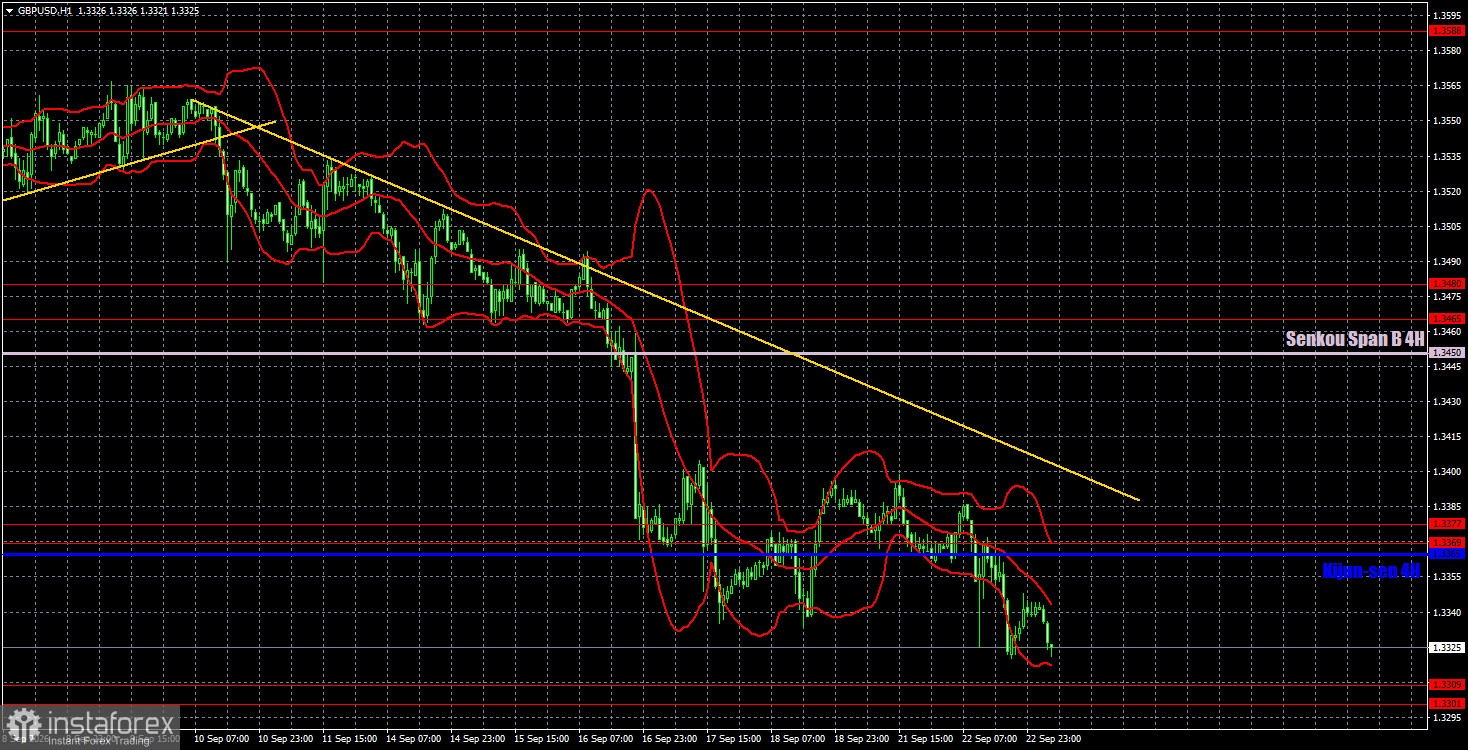
On the hourly timeframe, GBP/USD continues to form a downward trend. The Fed's decision and tone have materially changed the outlook for the US dollar and the market's attitude toward it. We would say that for the second time this year a "black swan" arrived in the market, delivering unexpectedly good news for the dollar. Therefore, it is now reasonable to doubt sterling's prospects for sustained gains.
For September 23 we highlight the following important trading levels: 1.3042–1.3050, 1.3096–1.3115, 1.3179–1.3187, 1.3301–1.3309, 1.3369–1.3377, 1.3465–1.3480, 1.3588, 1.3671–1.3681. The Senkou Span B line (1.3450) and the Kijun-sen (1.3365) can also generate signals. It is recommended to move the Stop-Loss to breakeven when the price moves 20 pips in the favorable direction. The Ichimoku lines may shift during the day, which should be taken into account when determining trading signals.
Today the UK and the US will publish business-activity indices for services and manufacturing for September. These are not the most important indicators and are unlikely to have a strong market impact. Traders continue to ignore much of the bullish data for the pound, so economic data are unlikely to support sterling today.
Today, traders may remain in short positions targeting 1.3301–1.3309, since two sell signals formed yesterday around 1.3369–1.3377. Open long positions if price bounces from the 1.3301–1.3309 area, targeting 1.3369–1.3377. Volatility today may again be low.
Support and resistance price levels are thick red lines where movement may conclude. They are not sources of trading signals.
The Kijun-sen and Senkou Span B lines are Ichimoku indicator lines transferred to the hourly timeframe from the 4-hour timeframe. They are strong lines.
Extreme levels are thin red lines from which the price has previously rebounded. They are sources of trading signals.
Yellow lines indicate trend lines, trending channels, and any other technical patterns.
Indicator 1 on COT charts shows the size of the net position of each category of traders.

