
আরও দেখুন


 17.11.2026 05:42 AM
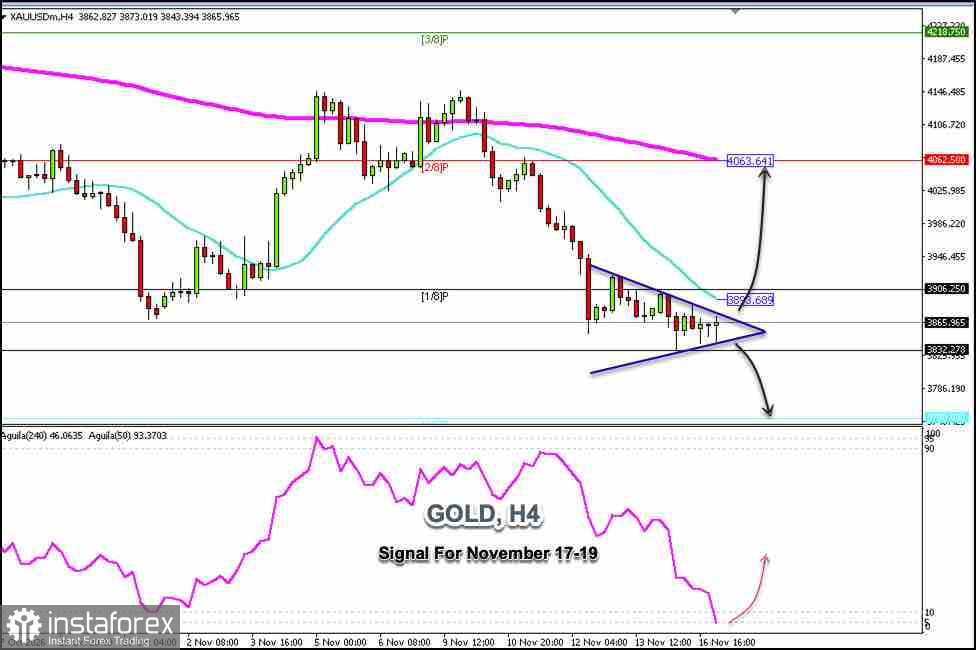
Gold is trading around $3,865 within a symmetrical triangle pattern that has been forming since November 12. From a technical standpoint, a strong upward move could be expected until it reaches the 200-day exponential moving average (EMA), which stands at around $4,063.
Conversely, if gold falls both below the pattern and its low of $3,832, strong downward pressure could intensify, and we could expect it to reach the Murray 0/8 level, around $3,750.
Given that gold has been consolidating for several sessions, our strategy could be to buy if the price consolidates above the 21-day simple moving average (SMA) and confirms a breakout from the symmetrical triangle pattern around the $3,900 level.
The Eagle indicator has reached oversold levels. From a technical perspective, we believe that a technical rebound around $3,850 would be considered a positive signal to continue buying in the coming days.
It is worth noting that gold left a gap on September 23 around $4,273, and technically, we could begin to look for a recovery scenario, as gold tends to rise during the months of November and December.
A rise in gold above the Murray 2/8 level, around $4,062, could be a positive signal to buy, and from a technical standpoint, we expect it to reach the Murray 3/8 level, around $4,218, and ultimately close the gap around $4,273.
You have already liked this post today
*এখানে পোস্ট করা মার্কেট বিশ্লেষণ আপনার সচেতনতা বৃদ্ধির জন্য প্রদান করা হয়, ট্রেড করার নির্দেশনা প্রদানের জন্য প্রদান করা হয় না।


