
আরও দেখুন


 06.11.2026 01:01 PM
The one-hour (H1) chart for Crude Oil (#CL) displays significant price volatility. Currently trading at 90.57, the asset is making a concerted effort to recover from a sharp preceding downtrend, evidenced by a rebound from a recent local low and movement within a newly formed ascending price channel.
Technical Analysis and Price Action
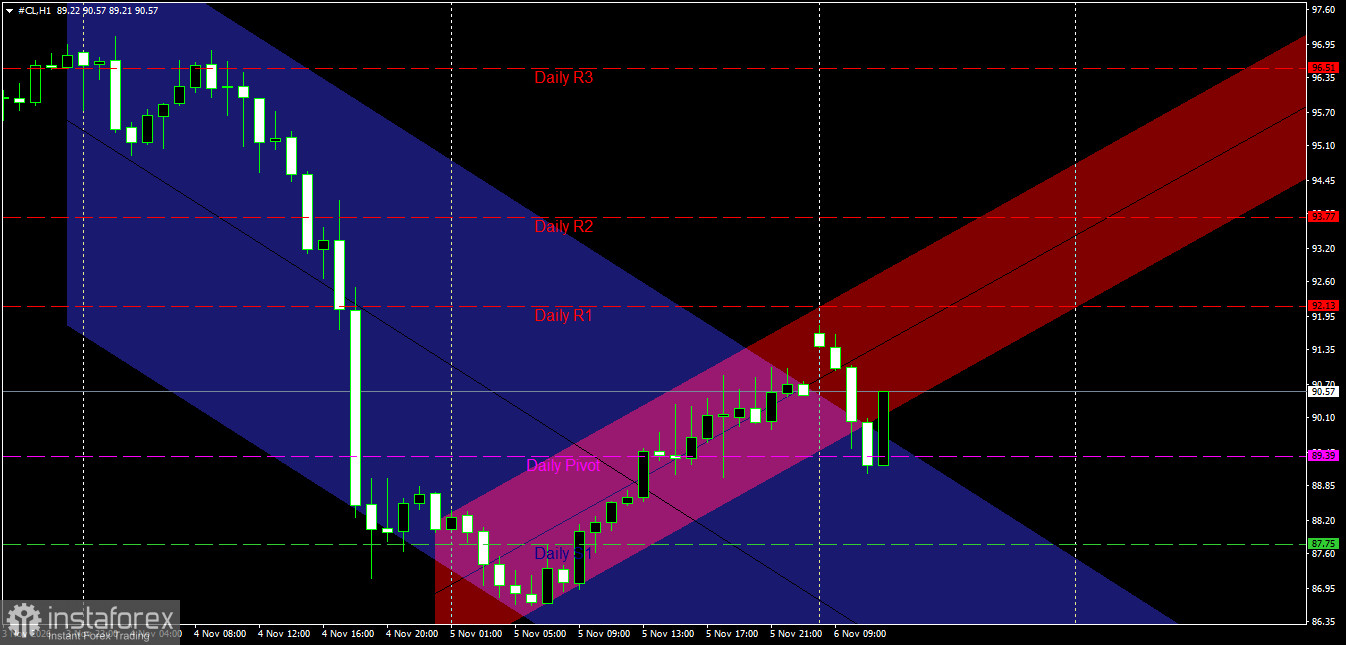
Price Channel Structure: The price has clearly broken out of a previous descending channel (marked in blue), which had pressured it toward a low in the 86.35–86.95 range. Subsequently, the price staged a strong rebound, establishing an upward trajectory within a steep, secondary ascending channel (marked in pink/red). Despite temporary corrective pullbacks, the price is consistently attempting to hold its position above the median line of this ascending channel.
Interaction with Pivot Levels: During its recent upward surge, the price broke through the daily pivot point at 89.39, targeting the area near the first daily resistance level (Daily R1) at 92.13. Although a recent short-term corrective pullback pushed the price back toward the lower boundary of the ascending channel, it currently remains supported above the daily pivot, keeping the potential for a continued positive trend intact.
Key Support and Resistance Levels Key Resistance Levels:
First Resistance: 92.13 (Daily R1 and the most recent intraday high).
Second Resistance: 93.77 (Daily R2).
Pivotal Resistance: 96.51 (Daily R3 and the upper boundary of the broken descending channel).
Key Support Levels:
First Support: 89.39 (Daily Pivot point and current pivotal level).
Second Support: 87.75 – 87.60 (Daily S1 and a nearby local low).
Pivotal Support: 86.35 and below (the most recent major low and the lower boundary of the price range).
Price Action Outlook and Trading Recommendations:
Bullish Scenario (Primary):
A positive outlook is favored for the intraday timeframe, provided the price remains stable above the daily pivot point of 89.39 and above the boundaries of the newly formed ascending channel.
Recommendation: Consider long positions (buying) if the price holds above 89.39, or upon a corrective pullback toward the 90.00 level.
Technical Targets: A retest of the first daily resistance at 92.13, followed by an extension toward 93.77.
Bearish Scenario (Alternative):
This scenario is triggered if selling pressure returns and the price fails to hold above the daily pivot point, shifting the trend back to the downside.
Confirmation Condition: A clear hourly candle close below the 89.39 level. Technical Objectives: A pullback to target the first daily support level at 87.75, followed by a test of the major low at 86.35.
Risk Management
Trading in crude oil markets requires adherence to strict capital management rules, given the rapid volatility and shifts in price momentum. Risk per trade should be capped at a maximum of 2%, and stop-loss orders must be precisely implemented to protect the portfolio.
Price Action on the Crude Oil Daily Chart:
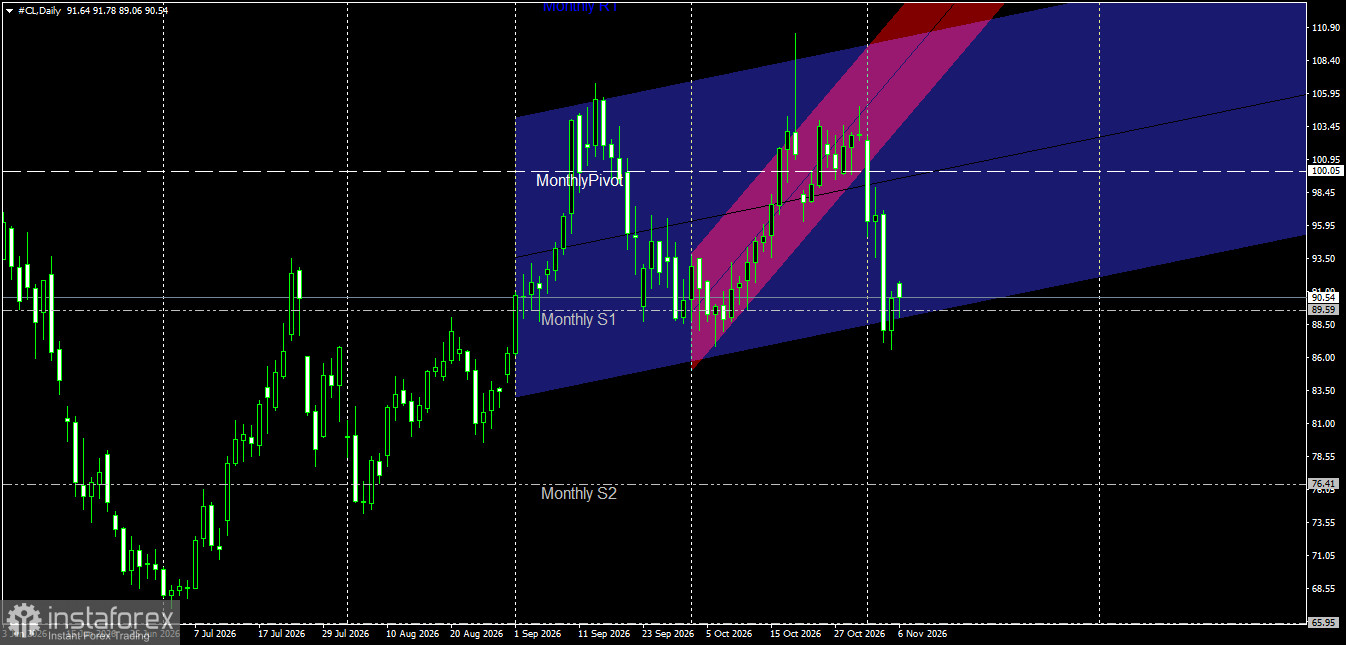
The price is currently trading at the 90.54 level within an ascending channel on the daily timeframe. It has experienced a sharp decline and selling pressure, pushing it below the monthly pivot point at 100.05, as well as the first monthly support level (Monthly S1) at 89.59.
Analysis of the Last Two Candles (Yesterday's and Today's):
Yesterday's Candle: Reflected a steep decline and strong selling momentum, which led to a breakdown through the median lines and sub-channels, driving the price toward nearby support zones.
Today's Candle: Shows signs of slight consolidation, with trading stabilizing near the 90.54 level, though negative pressure remains dominant.
Outlook for Future Movement:
Bearish Scenario (Primary): This remains the most likely outcome as long as the price stays below the monthly pivot point and key resistance levels. The decline could potentially continue, targeting the next support level at 76.41 (Monthly S2).
Bullish Scenario (Alternative): This would be triggered if the price manages to establish a support base and regain buying momentum, allowing it to climb back above the first monthly support level and test nearby resistance levels.


